Black Friday Exclusive: $2 for 2 Months + 50% Off Any Plan
Black Friday: 50% Off
Debugging with the JS Console Log
CheckView enhances your debugging capabilities by capturing the JavaScript console log for each test step. These logs provide detailed information about JavaScript errors, warnings, and messages during the execution of your tests. Additionally, the console log reports the number of pop-ups or modals removed by CheckView during the test flow, helping you identify and confirm that obstructive elements were successfully handled.
How to Use JavaScript Console Logs
- Logging During Test: When you run a test in CheckView, the JavaScript console logs are automatically recorded for each test step. These logs are pulled directly from the Chrome browser used to execute your tests.
- Accessing Console Logs After the test execution is complete, go to the test results page and select the specific test step you want to investigate.
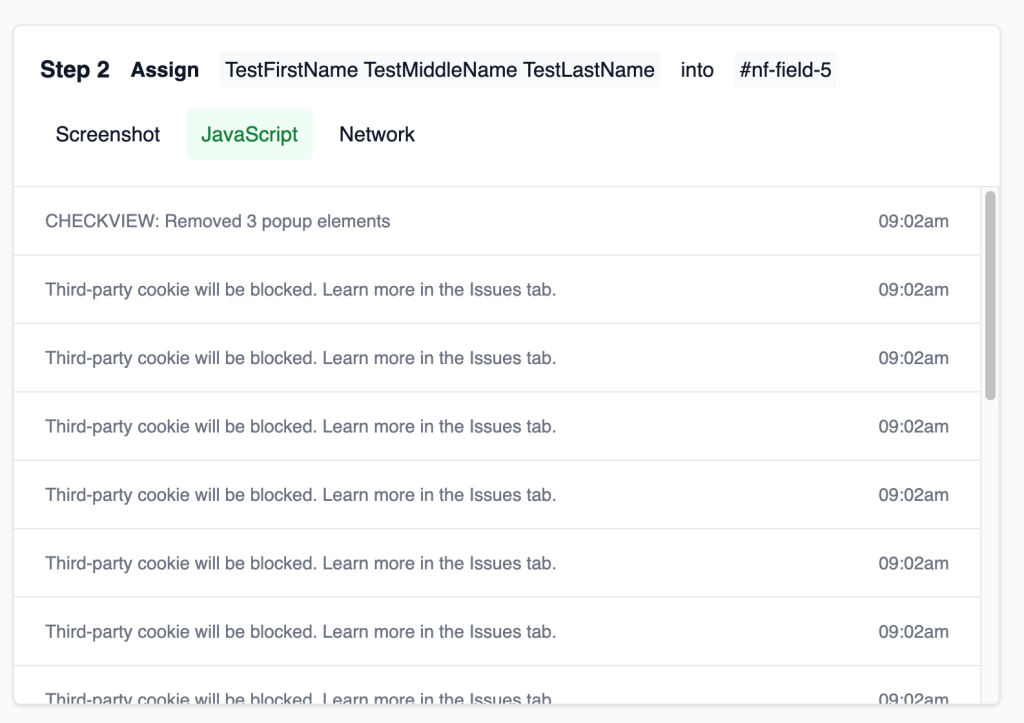
- View the Logs: Each test step includes a second tab labeled Javascript. Click on this tab to view the JavaScript console logs for that step.
- Analyzing Console Logs: Once in the Javascript tab:
- Review entries such as errors, warnings, and informational messages.
- Look for issues like:
- JavaScript syntax or runtime errors.
- Missing resources (e.g., images, scripts, or stylesheets).
- Deprecation warnings or other relevant notices.
- Pop-Up/Modal Removal:
- The console log includes a summary of how many pop-ups or modals CheckView detected and removed during the test. This ensures that obstructive elements do not interfere with test execution.
- Share specific log entries with your development team to assist in resolving the identified issues.
Pro Tip: Pay attention to error messages in the logs, as these often point directly to the root cause of test failures or unexpected behavior. Also, verify the pop-up/modal removal count to confirm CheckView handled dynamic elements correctly.